Bid-ask spread calculation: measuring intraday liquidity
On SPY at 10:30 AM ET under normal volatility, the best bid prints 449.99 and the best ask prints 450.01. The nominal spread is $0.02.
Garrett Croft·Updated: July 12, 2026·9 min read
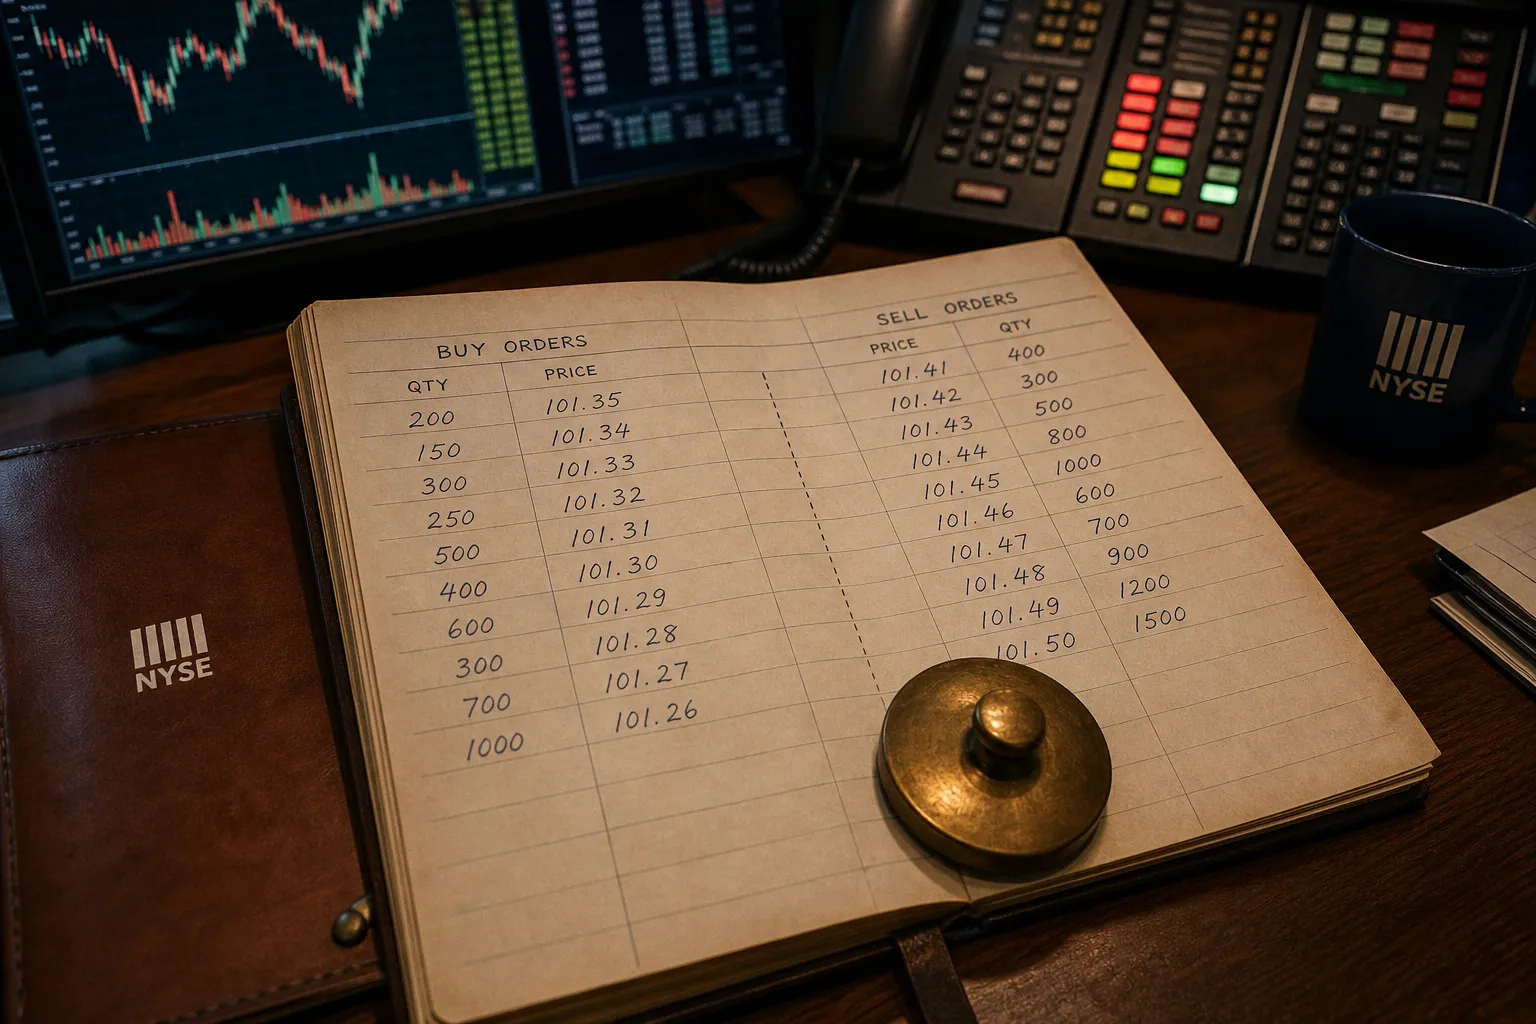
Bid-Ask Spread Calculation: Measuring Intraday Liquidity
Core Mechanics of the Bid-Ask Spread
The spread is the distance between the highest standing buy order and the lowest standing sell order on a lit exchange. Three variables govern it: posted depth at the inside, the inventory position of the market maker providing the quote, and the realized volatility of the underlying instrument.
A market maker quoting a $0.01 wide spread on a stock with a $0.01 minimum tick size is offering zero margin per round-trip trade. The quote is sustainable only because the maker expects to capture inventory turn — buying and selling against the posted quote hundreds or thousands of times per session. On a $0.0001 minimum tick instrument (sub-penny eligible securities, certain ETP products), a one-tick spread is 0.01 cent, not 0.1 cent, and the same logic applies at a smaller scale.
Three structural points anchor the mechanics:
- Best bid: the maximum price any market participant is currently willing to pay for the instrument.
- Best ask: the minimum price any market participant is currently willing to accept.
- Inside market: the pair formed by best bid and best ask, representing the tightest execution available on a lit venue at that millisecond.
The inside market is not the entire market. It is only the front edge of the order book. Depth beyond the inside — the second, third, and tenth levels — sits in the queue and only becomes executable if the inside is consumed.
Mathematical Approach to Spread and Midpoint Calculation
The absolute spread is the subtraction of two prices. The percentage spread is the normalization of that subtraction against the midpoint. Both metrics are required; neither is sufficient alone.
Absolute Spread Formula
Spread (absolute) = Ask Price − Bid Price
Example: AAPL shows bid 187.42 / ask 187.44. The absolute spread is $0.02.
Midpoint Formula
The midpoint is the geometric center of the quote. It is the reference price used by algorithms to measure slippage against arrival.
Midpoint = (Bid + Ask) / 2
Example: (187.42 + 187.44) / 2 = 187.43. A market order filled at 187.44 against an arrival midpoint of 187.43 incurs $0.01 of slippage, equivalent to one tick.
Percentage Spread Formula
Percentage Spread = (Ask − Bid) / Midpoint × 100
Example: 0.02 / 187.43 × 100 = 0.0107%. That is the normalized transaction cost to cross the spread on AAPL at that print.
The three formulas form a calculation chain. The absolute spread quantifies the raw gap in price units. The midpoint defines the reference price for execution benchmarks. The percentage spread normalizes the gap for cross-instrument comparison. A trader holding two candidates — one at $400 with a $0.04 spread and one at $4 with a $0.04 spread — receives identical absolute readings but a 100-fold difference in percentage spread. Without normalization, the comparison is meaningless.
The absolute spread measures the gap. The percentage spread measures the cost. The midpoint measures the reference. All three are required to evaluate a quote.
Normalizing Liquidity with Percentage Spread Analysis
Percentage spread converts an instrument-specific number into a comparable liquidity score. The table below applies the formula to four representative tickers at a single hypothetical print:
| Ticker | Bid | Ask | Midpoint | Absolute Spread | % Spread |
|---|---|---|---|---|---|
| SPY | 449.99 | 450.01 | 450.00 | $0.02 | 0.0044% |
| AAPL | 187.42 | 187.44 | 187.43 | $0.02 | 0.0107% |
| XYZ (mid-cap) | 34.95 | 35.05 | 35.00 | $0.10 | 0.2857% |
| ABC (small-cap) | 3.39 | 3.41 | 3.40 | $0.02 | 0.5882% |
SPY and ABC carry identical absolute spreads. SPY costs 0.0044% to cross; ABC costs 0.5882% — a factor of 133. Scalping structures that depend on capturing one tick of edge will not survive on ABC with the same position sizing used on SPY.
Three bands serve as standard reference points in liquidity classification:
- Tight (% spread below 0.05%): large-cap, high-volume, deep book. Typically HFT-dominated quoting.
- Moderate (% spread between 0.05% and 0.30%): mid-cap names with adequate but not exceptional depth. Single market-maker dominance is common.
- Wide (% spread above 0.30%): small-cap, low-float, or event-driven names. Posted depth is thinner, quote refresh cadence is less consistent, and resting orders at the inside are more likely to be pulled before a marketable order arrives.
The bands are not universal. They shift with volatility regime. During a VIX print above 30, the 0.05% tight cutoff relaxes to 0.10% because quoted depth contracts across the board. The classification must be re-anchored each session.
Interpreting Market Depth Beyond the Visible Order Book
Level 2 market data displays the queue behind the inside — the depth resting at $0.01, $0.02, $0.05, and $0.10 away from the midpoint on both sides. This data is necessary but not sufficient for execution planning.
Visible depth at the second level on a $50 stock might show 15,000 shares bid at 49.99 against an inside bid of 50.00. To the algorithmic trader, that stack is an execution floor — a support zone where resting buy orders will absorb incoming sell flow before price breaks 49.99. To the discretionary tape reader, the same stack is a liquidity pool that will vanish the moment the inside bid lifts.
Four properties of Level 2 data constrain its interpretation:
1. Latency of display: Level 2 refreshes at venue-dependent intervals, typically 250–1000 milliseconds for retail feeds. Institutional direct feeds refresh sub-millisecond. A retail view of Level 2 is a delayed view of a real-time queue.
2. Cancellation velocity: resting orders at levels beyond the inside carry high cancellation rates. Stacks displayed on screen have often been pulled by the time a market order reaches them. This is the spoofing risk in its measurable form.
3. Off-exchange exclusion: Level 2 reflects lit venue depth only. Dark pool liquidity — the subject of the next section — does not appear in the displayed book.
4. Queue position cost: even when depth is real, the queue position determines fill priority. A 5,000-share bid at 49.99 sitting behind 12,000 shares of earlier-arrived orders will only fill if those earlier orders are consumed first.
Level 2 is a structural map of the order book, not a forecast of execution. It shows where liquidity was posted at the last refresh. It does not show where liquidity will be posted when the next marketable order arrives.
Impact of Volatility and Dark Pools on Execution Quality
Two forces drive the spread off its resting state: realized volatility and off-exchange routing.
Volatility Effect
When realized volatility expands — measured by the difference between current and 20-day average true range — market makers widen quotes to compensate for adverse selection risk. A market maker quoting $0.02 on AAPL during a quiet session may widen to $0.05 during the same session's earnings release. The percentage spread shifts from 0.01% to 0.027%. Spread widening is not a signal of deteriorating fundamentals; it is a signal of pricing-model recalibration to a new variance input.
Dark Pool Effect
Dark pools are alternative trading systems that execute institutional orders without displaying pre-trade quotes on the lit book. Their volume does not appear in the visible bid-ask spread, but it does affect post-trade prints and consequently the NBBO (National Best Bid and Offer) midpoint.
Two consequences follow:
- Reported spread understates true transaction cost: a retail trader crossing a $0.02 spread may be filling against an institutional order that was matched in a dark pool at the midpoint, with no retail liquidity actually posted at the inside. The visible spread is real, but the available size at that spread is lower than the book suggests.
- Latency arbitrage widens effective cost: high-frequency market makers detect dark pool prints through the consolidated tape and adjust their lit quotes before retail orders arrive. The retail fill prints at $0.02 but against a midpoint that has already shifted by $0.01 against the trader. Effective slippage doubles.
Visible spread measures quoted cost. Effective spread measures paid cost. The two diverge most during volatility expansions and at the close of the session when dark pool volume concentrates.
Alternative settlement architectures — including smart contract-based execution layers — attempt to replicate lit-book transparency on permissioned infrastructure. The relevance for intraday liquidity measurement is direct: any execution venue that operates outside the visible NBBO must be accounted for when computing effective spread, regardless of the settlement mechanism.
Execution Quality Assessment Protocol
Spread calculation feeds directly into execution benchmarks. Three parameters should be logged per fill to construct a post-trade spread analysis:
1. Arrival midpoint: midpoint at the moment the order was submitted to the broker or router.
2. Fill price: actual execution price, broken down by venue (lit exchange, dark pool, ATS).
3. Marked midpoint: midpoint at the moment of fill, for measurement of mark-to-market slippage.
The difference between fill price and arrival midpoint is the realized transaction cost. Aggregated across a session, this metric produces the trader's effective spread — the empirical number that matters more than any quoted spread observed before entry.
Parameter Checklist for Bid-Ask Spread Calculation
- Absolute spread computed as Ask − Bid per print.
- Midpoint computed as (Bid + Ask) / 2.
- Percentage spread computed as (Spread / Midpoint) × 100.
- Spread classified against the session's volatility-adjusted band (tight / moderate / wide).
- Level 2 depth at the second and fifth levels logged per side.
- Dark pool volume share estimated for the instrument (where reporting permits).
- Effective spread measured as Fill Price − Arrival Midpoint, aggregated per session.
- Spread metrics re-anchored after any volatility regime shift (VIX ±5 points, scheduled event, halt).
Binary Verdict
Bid-ask spread calculation is not a single formula. It is a four-step pipeline: raw spread extraction, midpoint computation, percentage normalization, and effective spread measurement against arrival. The first three steps are deterministic and computable from any Level 1 feed. The fourth step requires fill-level audit and venue attribution. A trader executing on the first three alone is measuring quoted cost. A trader executing on all four is measuring paid cost. The two diverge routinely, and the divergence widens during volatility expansions, at session close, and on instruments with elevated dark pool routing. Liquidity assessment without effective spread measurement is incomplete.