Commodity Trading Platforms Offering Advanced Charts and Technical Indicators
Execution latency on retail commodity platforms has compressed to 20 milliseconds.
Garrett Croft·updated July 09, 2026
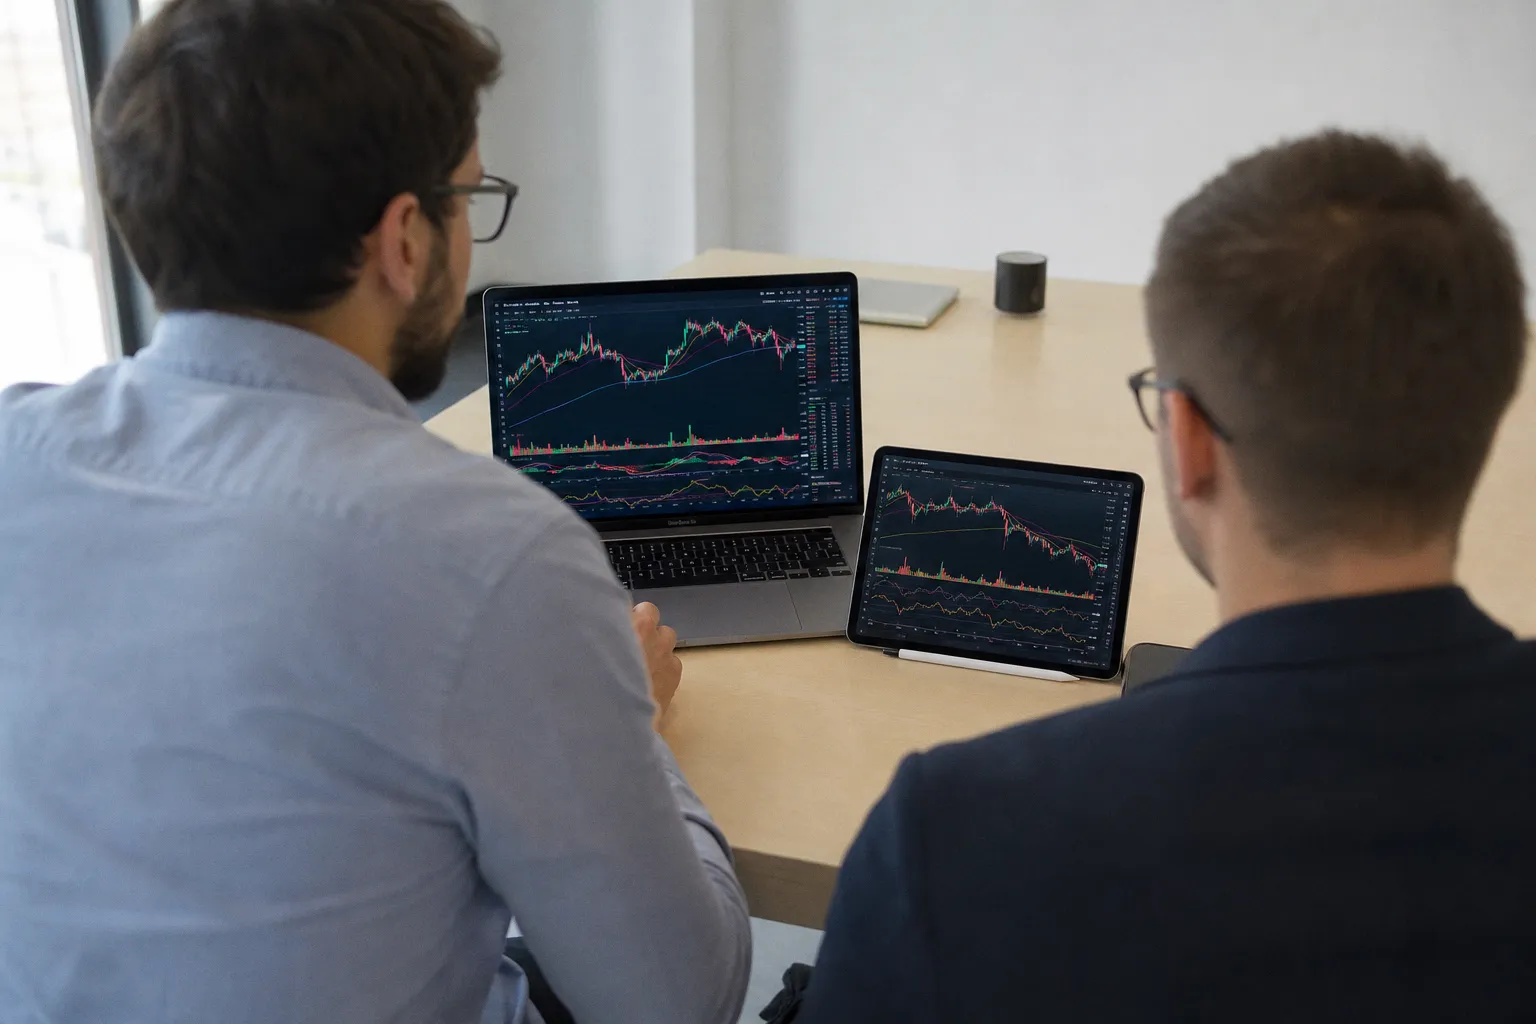
Chart capability benchmark
Indicator and tool counts across the three platforms, as reported:
| Platform | Indicators | Chart Types | Drawing Tools | Engine |
|---|---|---|---|---|
| Groww | 100+ | Multiple | Trendlines, S/R, channels, breakout zones | Native |
| Dhan | TradingView library | TradingView library | TradingView library | TradingView |
| Zerodha Kite | 100+ | 15+ | 30+ | TradingView + ChartIQ |
Indicator menu cited in the comparison: RSI, MACD, Moving Averages, Bollinger Bands, ATR, Supertrend. Multi-timeframe analysis is supported on all three. Zerodha Kite adds long-term historical commodity data for backtest and pattern studies. Dhan routes chart interaction and order placement through TradingView in a single workflow, eliminating screen switching between chart and order ticket.
Execution and data layer
Groww publishes execution speeds of up to 20 milliseconds for MCX commodities covering gold, silver, crude oil, natural gas, and other commodity derivatives. Data feed includes live commodity prices, Level 2 market depth, order-book visibility, custom watchlists, and scanners configured for momentum, breakout, and high-volume conditions. API surface covers live market data, order management, portfolio state, and margin details—sufficient for custom dashboards and automated execution workflows. Reporting module: live P&L, margin utilization, downloadable reports, strategy-level performance analytics.
Dhan runs TradingView as the primary chart surface. Order placement, option chain, and instant margin updates are integrated inside the chart view. Flash Trade is the documented execution feature. Real-time position management and a dedicated commodity dashboard consolidate positions, margins, and price action in a single screen.
Zerodha Kite pairs TradingView with ChartIQ as dual chart engines. Historical depth extends for long-term studies. Order placement is chart-native. Long-term historical commodity data is retained for technical analysis across extended lookbacks.
Parameter checklist
Items to verify before deploying capital on any of the three platforms:
1. Indicator count: ≥100.
2. Drawing tool count: ≥30.
3. Chart engine: TradingView, ChartIQ, or native.
4. Historical data depth: confirm coverage for required lookback period.
5. Published execution latency: target ≤20 ms.
6. Market depth: Level 2 availability confirmed.
7. API coverage: data, order, portfolio, margin.
8. Scanners: momentum, breakout, volume.
9. Custom layout persistence across sessions.
10. Live P&L and margin display refresh rate.
Match the above parameters against platform documentation before scaling position size on MCX contracts. Platform selection reduces to three variables: latency tolerance, API requirement, and indicator depth.